four
Initially released on June 30, 2018, tezos has served as the blockchain of choice for many digital artists.
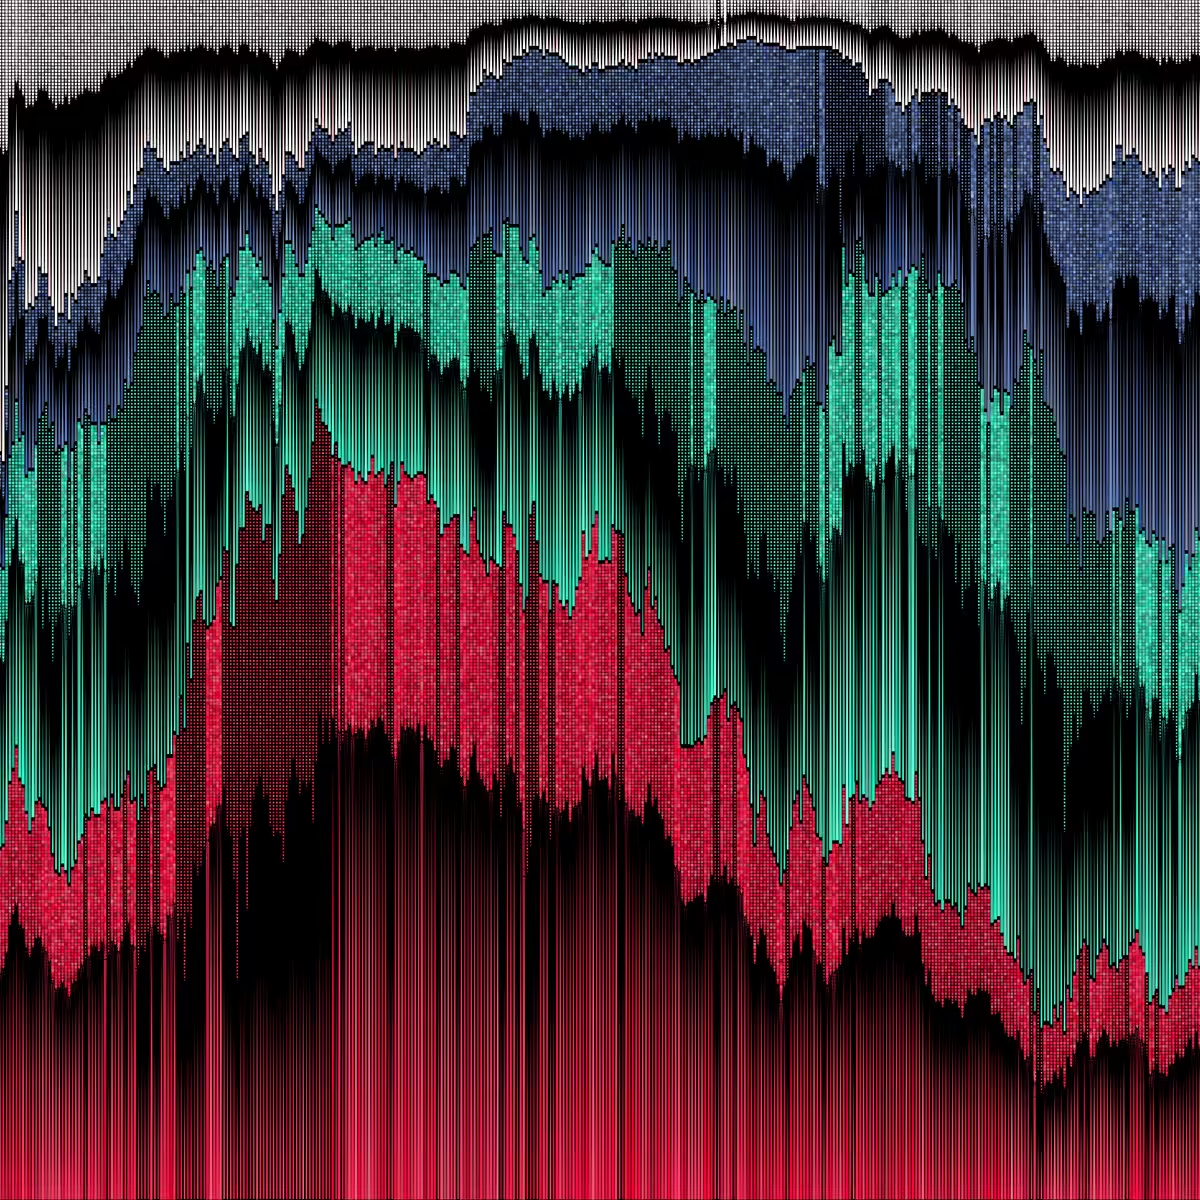
four utilizes tezos price data to transform four years of emotions–fear, greed, excitement, and uncertainty–into generative art. Carefully engineered to balance art and its origins (as price data), the undulating waves and cavernous corners within four represent the rollercoaster of emotions and dark spaces we experience during market turbulence.
As it's not clearly evident, tezos price data was used as follows: • Individual columns represent one day within a year, with 365 columns across the entire canvas. • Respective years are represented by color, with hue being the primary driver.
-
July 2018 - June 2019: tezos nascency, represented in white. -
July 2019 - June 2020: price stabilization, represented in blue. -
July 2020 - June 2021: momentum increases, represented in green. -
• Daily price is represented by the length of the colored section, compared against that same day in different years. • Represented by the long triangle within each day of price data, daily volume is compared against that year’s annual low and high volumes. • One additional use of volume data is the borders on each individual triangle. Thicker borders indicate higher volumes. • Perhaps overlooked, there are only two uses of random() incorporated into the data, providing variation to the saturation and brightness. Substituting tezos price data for randomized data provides for interesting outputs.July 2021 - June 2022: enthusiasm followed by a deep decline, represented in red.
Made with p5js, triangles, and tezos price data.
This NFT was part of the Blind Gallery (www.blindgallery.xyz).