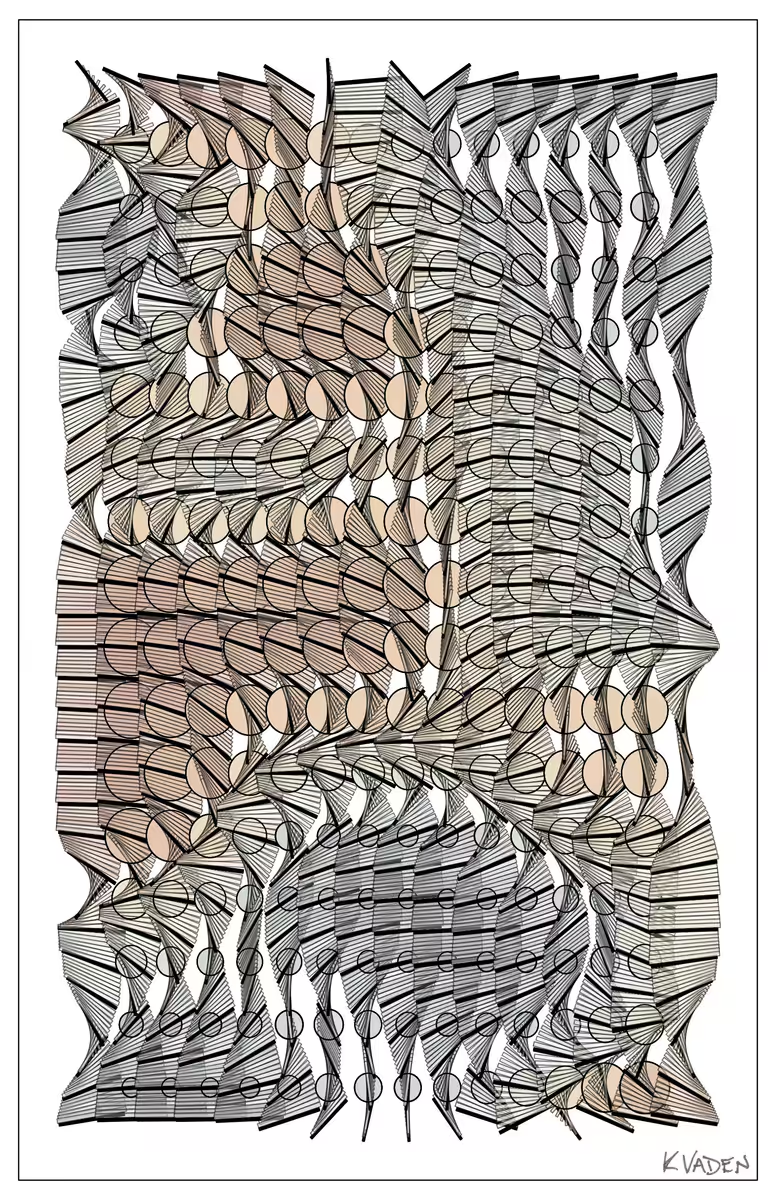
VADENGF01: We Just Begun 23
Artwork used for unique axidraw plotter prints gifted to my collectors and artist friends in attendance at Art Blocks Weekend 2026 in Marfa, Tx. This is a unique iteration (number 23) from a limited edition run of artisinally coded system in the R Statistics language. Iterations 1-22 were rendered as physical drawings using an axidraw robotic pen plotter (black ink on archival paper). The current algorithm created a 16x34 grid of random numbers that were Gaussian smoothed into an omnidirectional flow field, which was used to control colors, circle sizes, and rotated rectangles throughout the plot space. Each column in the grid was plotted left to right, first with circles then black rectangles. Between each pair of the black rectangles, eight colored rectangles were plotted with rotations determined by weighted averages of the pair above and below. Circle and rectangle colors were determined as a function of the flow field, lightening the color palette for fill colors and darkening the colors for edge lines. The selected smoothness level allowed for common patterns of spatial variance, but also permitted turbulence across the surface.