Owned byabyssushiro.eth
Description
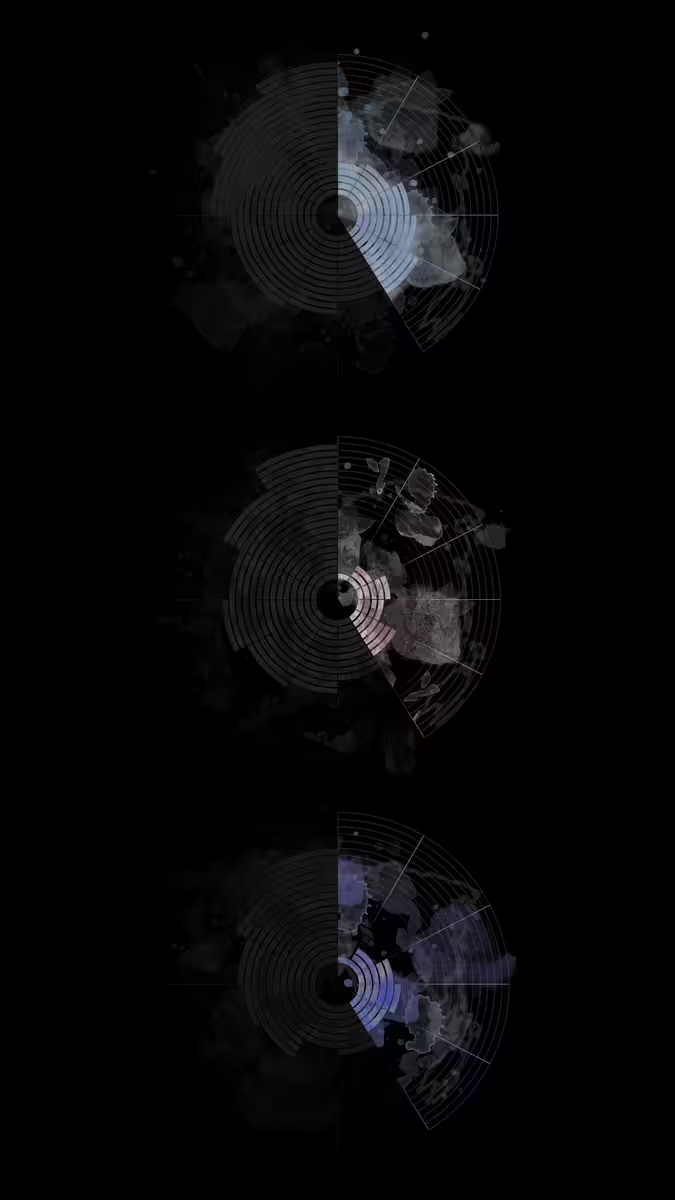
In this piece, I tried to raise awareness to the global warming by showing the three major indicators of it by using these circular charts which represent the CO2 emissions (top), sea level rise (middle) and temperature (bottom) changes through years. Each slice can be thought as timeframes and the occupancy of the slices represent the units of them. Each day/night these charts start from the past when everything is sweetness and light and end with the current level of the global warming, which create a loop of awareness reminding us each day that we can't change the past and motivates us to take action for a better future.
On-chain
Market
Provenance