Hash In Space
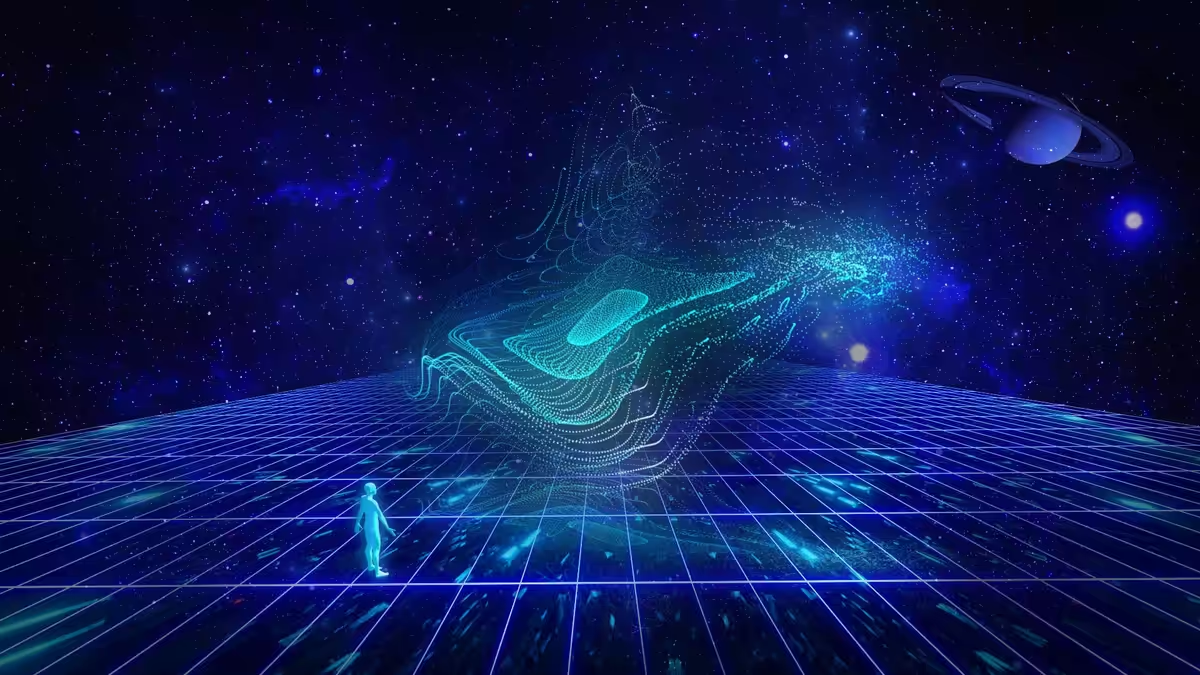
Hash in Space is a mix of Programmable + Generative Art inspired by Ethereum and Outer Space. The idea is to create a visual representation of Ethereum Network hash rate throughout the past 5 years from 2016 to 2020.
To create this, daily Ethereum average hash rate data was collected (source: Etherscan.io) and converted to values consisting of a whole year's total, median and average. The interaction between data and graphics was done through associating the entire year's values to pre-defined range modifiers into a graphic particles system.
A javascript math script was created to convert the hash rate year values in GH/s to 6 particles system modifiers values: Particles Count X, Particles Count Y, Displacement, Fractal Scale, Random Swirl Y and Force Relative Position X.
The result is a mix of reality and sci-fi, present and future, precise data and visual satisfaction. Maybe this is the way we will visualize data in the future. Or maybe, by that time, the space is the place where we will be.